
COPILOT IN POWER BI
Power BI Copilot Prompts: DAX, Dashboards, And Data Exploration Examples
Copilot in Power BI is a chat-based assistant that can draft DAX measures, build report pages, and answer questions about your data. Power BI Copilot prompts work best when they are specific: naming your actual tables, columns, and business terms instead of asking generic questions.
Key Takeaways
Who This Is For
Power BI report authors and BI analysts who already build reports and want a practical library of Copilot prompts for DAX, report creation, and data exploration.
In This Guide
What Copilot Can Actually Do In Power BI
Microsoft splits Copilot in Power BI into two audiences, and the prompts you write should match which one you are.
Both roles hit the same wall: Copilot answers from your semantic model when a question relates to your data, and from the underlying language model’s general knowledge otherwise. If your data isn’t modeled cleanly, or your business terms aren’t documented, Copilot has nothing reliable to draw from.
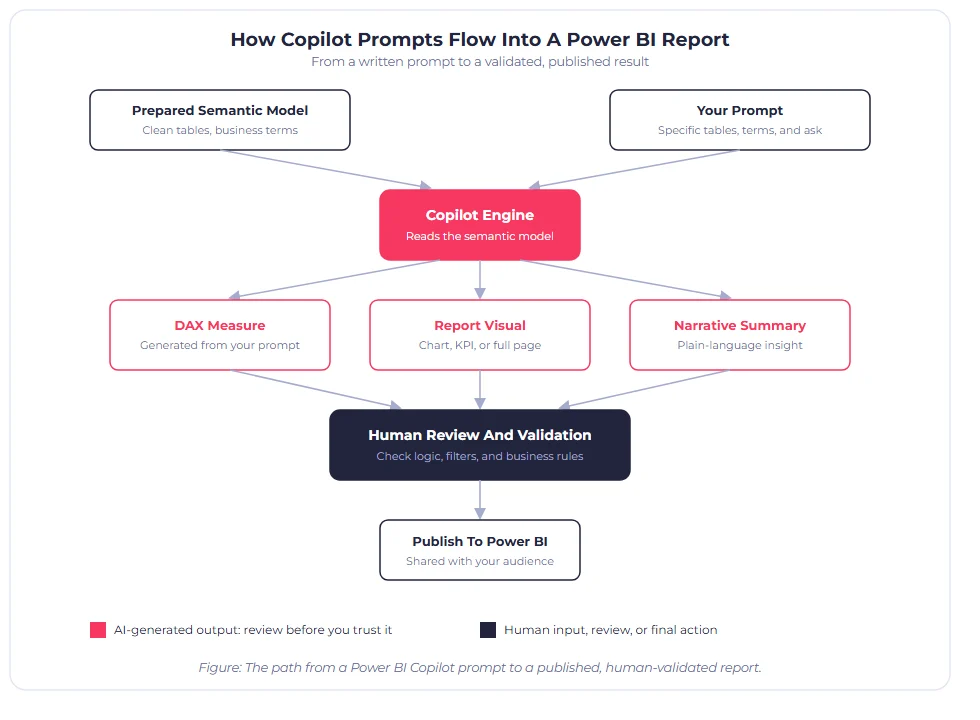
Figure 1: The path from a Power BI Copilot prompt to a published, human-validated report.
Prompt Examples For DAX Measures
DAX generation is one of the most requested Copilot use cases, and it is also where vague prompts fail the most obviously. Reference your real measure and column names every time.
| Goal | Prompt |
|---|---|
| Basic aggregation measure | “Write a DAX measure named Total Rental Revenue that sums the RentalAmount column from the FACT_RENTALS table.” |
| Time intelligence measure | “Write a DAX measure that calculates year-over-year growth in Total Rental Revenue, using the DIM_DATE table marked as a date table.” |
| Filtered measure | “Write a DAX measure for Average Rental Days that only includes rentals where VehicleClass equals ‘SUV’, using CALCULATE and a filter on DIM_VEHICLE.” |
| Measure explanation | “Explain what this DAX measure does in plain language, step by step: [paste your measure].” |
| Measure description | “Draft a one-sentence description for the measure Total Rental Revenue, suitable for a business user browsing the semantic model.” |
Pro tip: Ask Copilot to explain a DAX measure it just wrote before you use it. Explaining forces it to restate the logic in plain language, which is often where you catch a filter context mistake.
Prompt Examples For Report And Dashboard Creation
Copilot’s report-building capability works from a written prompt describing what you want to see, not from a blank canvas.
| Goal | Prompt |
|---|---|
| Create a report page | “Create a report page showing Total Rental Revenue by month, Vehicle Class, and Rental Location, using a combination of a line chart and a bar chart.” |
| Add a KPI summary | “Add a card visual showing Total Rental Revenue for the current quarter compared to the prior quarter.” |
| Generate a narrative visual | “Add a narrative visual that summarizes the key trends in Total Rental Revenue by Vehicle Class for this report page.” |
| Summarize an existing report | “Summarize the key insights on this report page in three bullet points a regional manager could read in ten seconds.” |
| Redesign for an audience | “Suggest a layout for this report page aimed at store managers who need to check daily rental volume in under 30 seconds.” |
Prompt Examples For Data Exploration
These prompts work through the Copilot pane on an open report or the standalone Copilot experience, and they lean on Copilot’s ability to answer questions using your semantic model directly.
| Goal | Prompt |
|---|---|
| Ad hoc question | “Which rental location had the highest Total Rental Revenue last month?” |
| Trend question | “Has Average Rental Days increased or decreased over the last four quarters?” |
| Comparison question | “Compare Total Rental Revenue between SUV and Sedan vehicle classes for this year.” |
| Anomaly question | “Are there any rental locations where revenue dropped more than 15 percent compared to the prior month?” |
| Find content | “Find any reports or semantic models related to vehicle rental revenue that I have access to.” |
Copilot Limitations You Should Know
Prompt-Writing Checklist
Use this before you send a Copilot prompt in Power BI, especially for DAX or report-building tasks.
Frequently Asked Questions
Write Prompts That Match What Copilot Can Actually Do
Power BI Copilot prompts work best when they read like instructions to a new analyst who knows nothing about your business yet: specific table names, specific business terms, and a specific ask. The Copilot in Microsoft Fabric & Power BI course covers preparing your semantic model and building AI-assisted reports end to end, and connects to Chapters 9 and 11 of Business Intelligence in the Age of AI.
Related Free BI Resources
Not ready to enroll yet? Start with these free BI Academy resources.